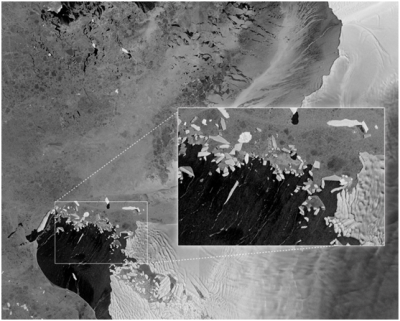
Satellite SAR is a form of imagery where pulses of radar are used to create images of the Earth surface. The images are unaffected by clouds and work equally well during day and night. Imaging radar is similar to a photograph taken by a camera, but the image is of radar waves, not visible light.
Sea ice typically reflects more of the radar energy emitted by the sensor than the surrounding ocean, which makes it easy to distinguish between the two. But the amount and character
of reflected energy are functions of the physical properties of the sea ice, which can be quite complex; thus, it can be difficult to interpret radar images of sea ice. In the past the
Antarctic was extensively imaged using the ENVISAT ASAR instrument. More recently we have provided access to Radarsat2 and Cosmo-Skymed SAR imagery. In the very near future we will provide
rapid access to imagery from the new European Sentinel-1 satellite.
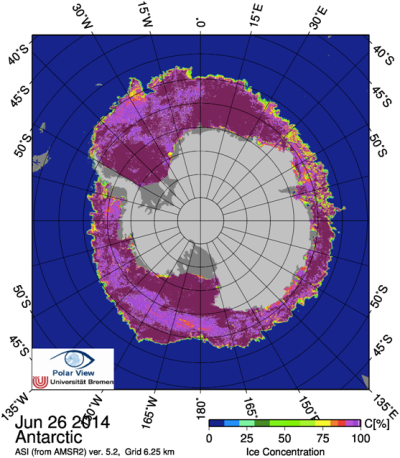
The Earths surface emits low levels of microwaves in addition to infrared radiation. Certain satellite sensors are able to detect this passive microwave radiation. Clouds do not emit much microwave radiation, compared to sea ice. Thus, microwaves can penetrate clouds and be used to detect sea ice during the day and night, regardless of cloud cover.
Sensors that detect passive microwave radiation can easily distinguish sea ice from ocean. These data are used to provide a daily picture of the sea ice cover, recorded as sea ice concentration.
A major drawback to measuring passive microwave radiation is that the energy level is quite low. As a result, the radiation must be collected over a larger region and the resolution of the data is low. These sensors have provided the most complete, long-term observations of sea ice in the Arctic and Antarctic.
Sea ice observations from passive microwave sensors began in 1972 and a series of satellite instruments have provided continuous data up to the present day. Currently we use the sea
ice concentration maps produced by the University of Bremen from the AMSR2 instrument.
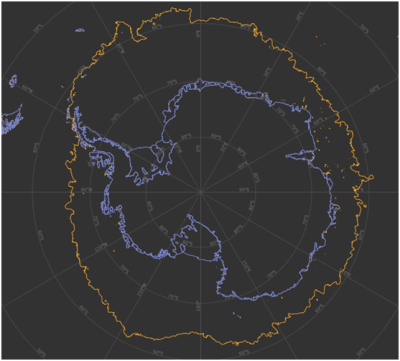
Using the passive microwave sea ice concentration data, we derived a daily sea ice edge. Using accepted convention, the edge is defined as the contour of 15% ice concentration.
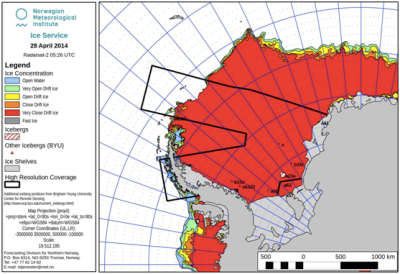
Many Arctic nations support national ice centres that produce regular ice charts to support shipping in their coastal waters. There are no national ice centres producing
sea ice charts for the Southern Ocean. However the US National Ice Centre and Norwegian Ice Service provide regular charts for parts of the Antarctic. Met Norway produce
a detailed weekly analysis during the austral summer months and US NIC produce a lower resolution weekly ice chart and daily MIZ (marginal ice zone) product.
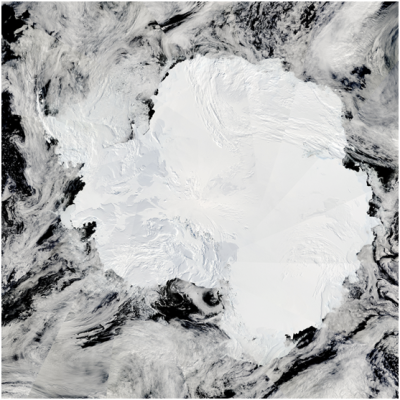
Optical satellite imagery can provide additional regular information about sea ice in the Southern Ocean. "Whiter" objects (those with a high albedo) reflect more radiation than "darker" objects. Sea ice has a higher albedo than the surrounding ocean, which makes it easy to detect from visible remote sensing instruments. However this data does have limitations including only working during hours of day light and therefore not during the polar winter, and cloudy skies prevent the instruments from detecting light reflected from the sea ice.
A number of satellite sensors collect suitable data, but currently we make sue of daily MODIS mosaics produced by NASA. These are regularly updated throughout the day as
new imagery becomes available.